TransitPulse

Portfolio project · 2026

TransitPulse

A web app that records Edmonton's live transit data and turns it into a live vehicle map, a replayable history and route reliability reports. An experimental planning tool, trained on timetables from eight North American transit agencies, estimates how a route change would affect trip times and the number of vehicles needed.

  • FastAPI · PostgreSQL/PostGIS
  • Next.js · React · MapLibre
  • 1.8M recorded vehicle observations
  • Runs locally · not deployed
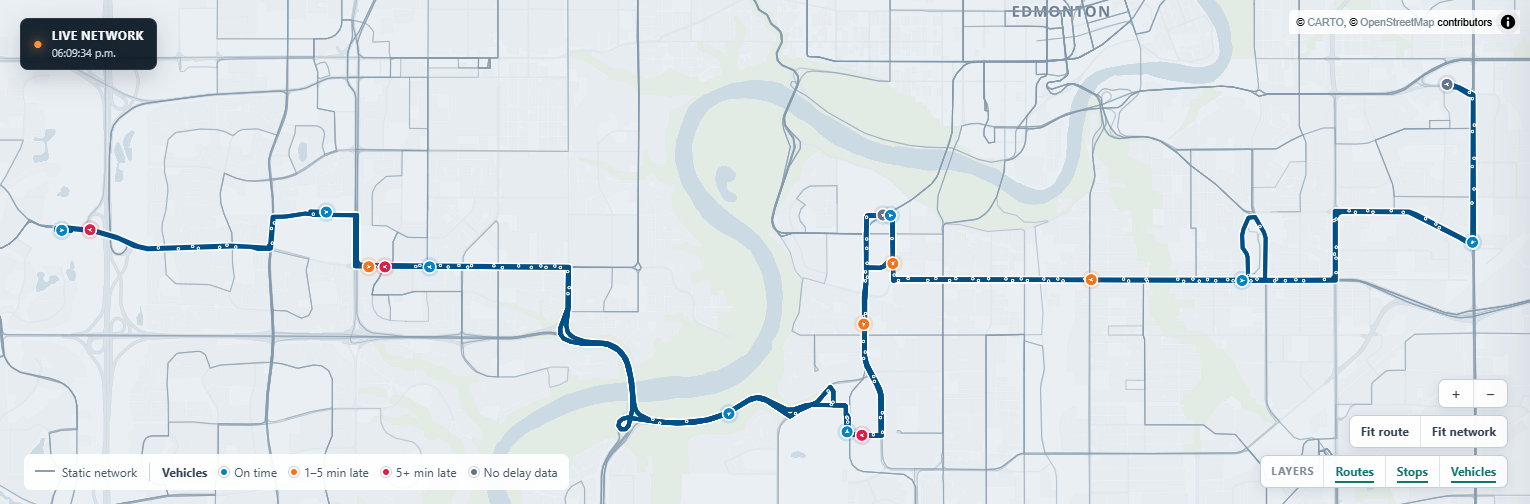
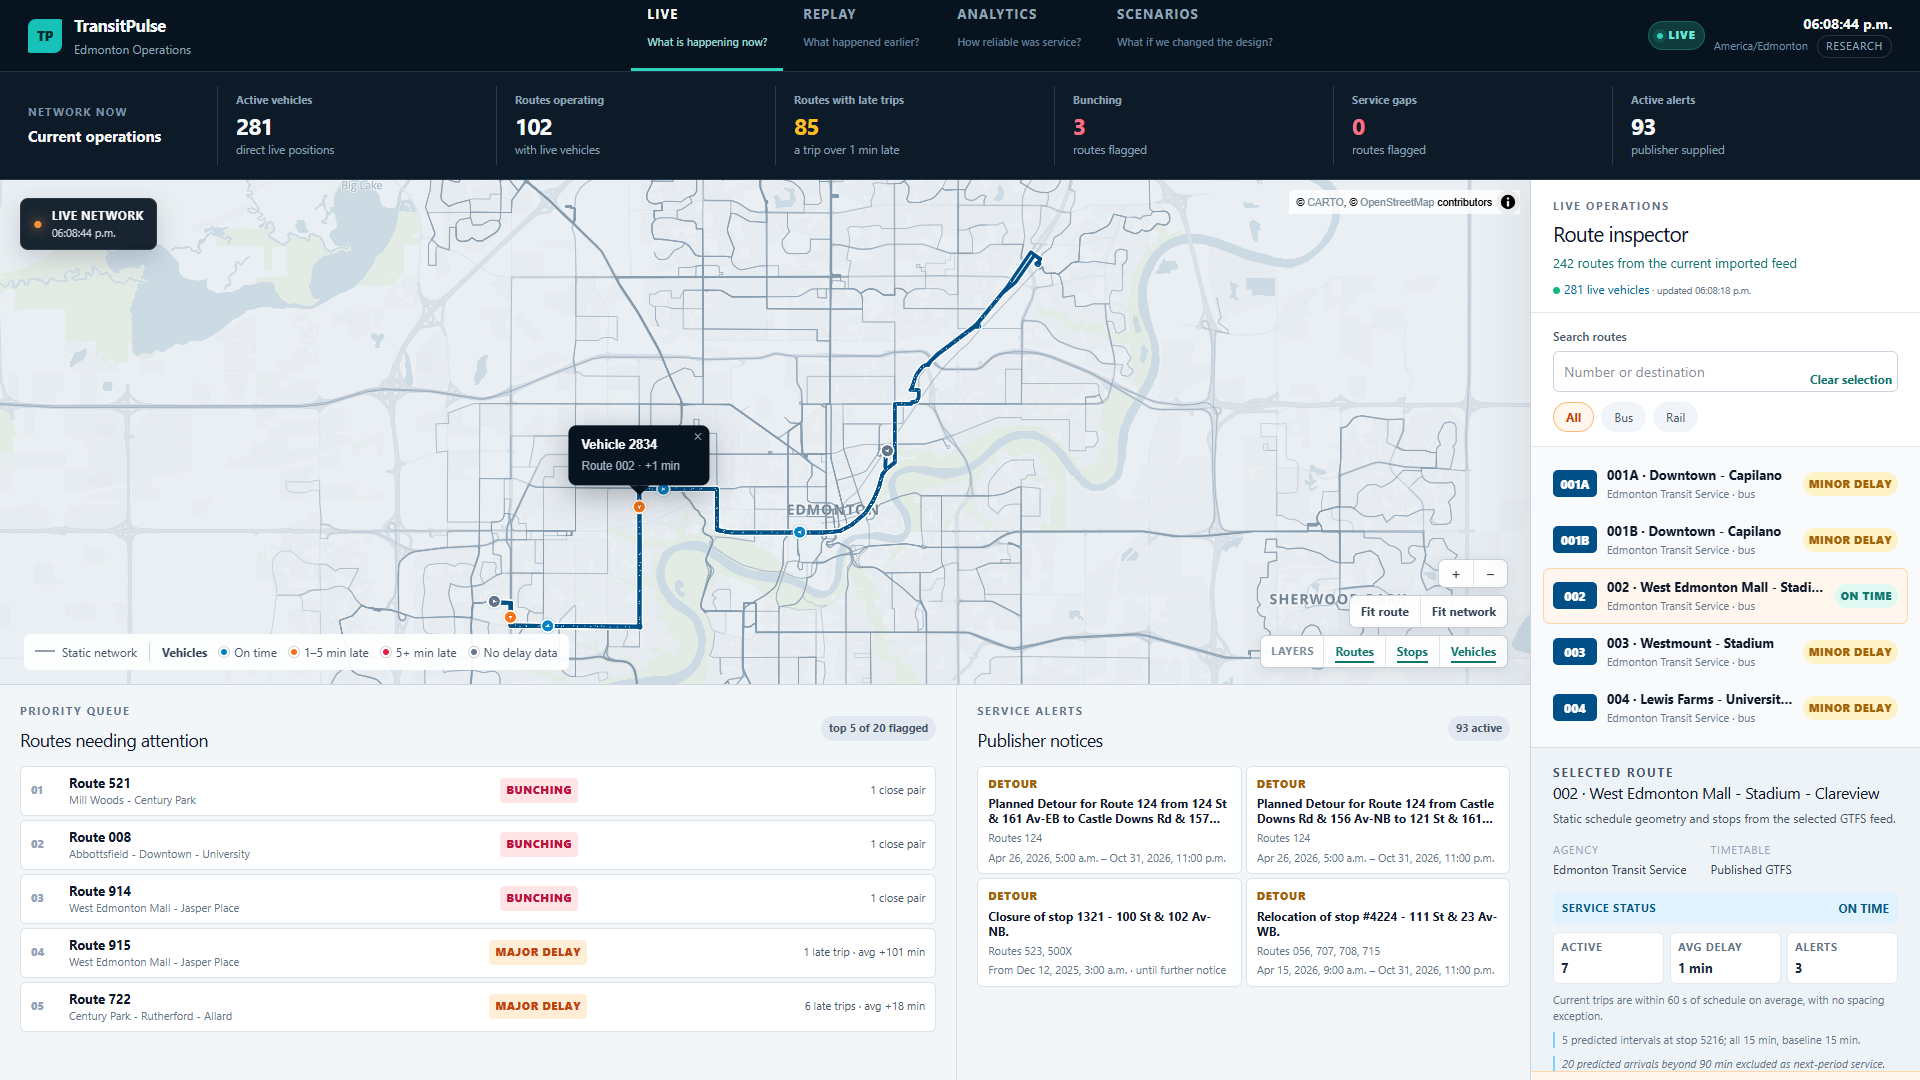
TransitPulse LIVE mode: a map of Edmonton with vehicles coloured by delay, a selected route, a queue of routes needing attention and publisher service alerts.

LIVE mode on 2026-09-12: Edmonton Transit Service vehicles coloured by delay, one selected route and the list of routes needing attention.

What it does

One web application with four modes. Each mode answers a single question, and each keeps measured values visibly separate from estimates.

LIVE mode screenshot
Live

What is happening now?

Every reporting vehicle on a map, coloured by how late or early it is. Routes that need attention are flagged: buses bunched together, long gaps in service, or an average of 5+ minutes late or early. Service alerts and a route inspector sit alongside.
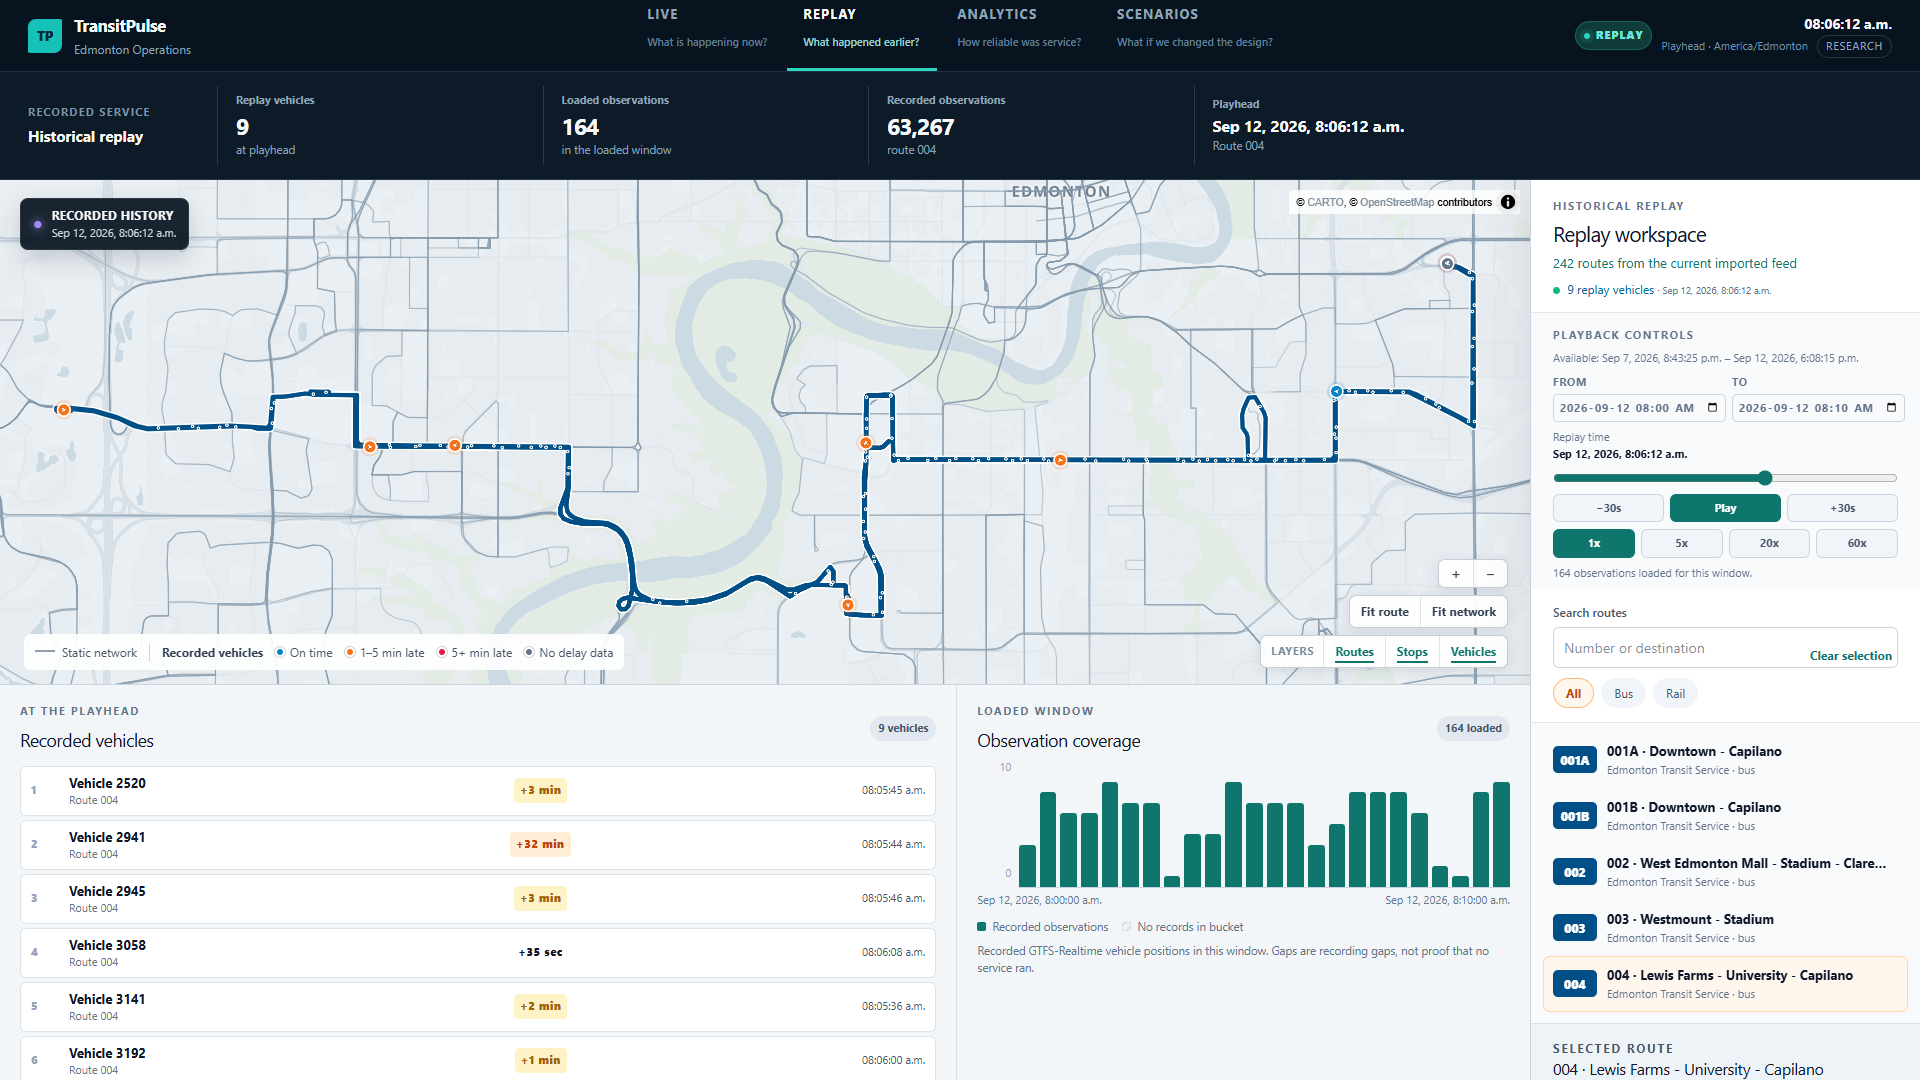
REPLAY mode screenshot
Replay

What happened earlier?

Plays back where vehicles were at an earlier time, from a recorded history that is only ever added to. A coverage chart shows gaps in the recording rather than filling them in.

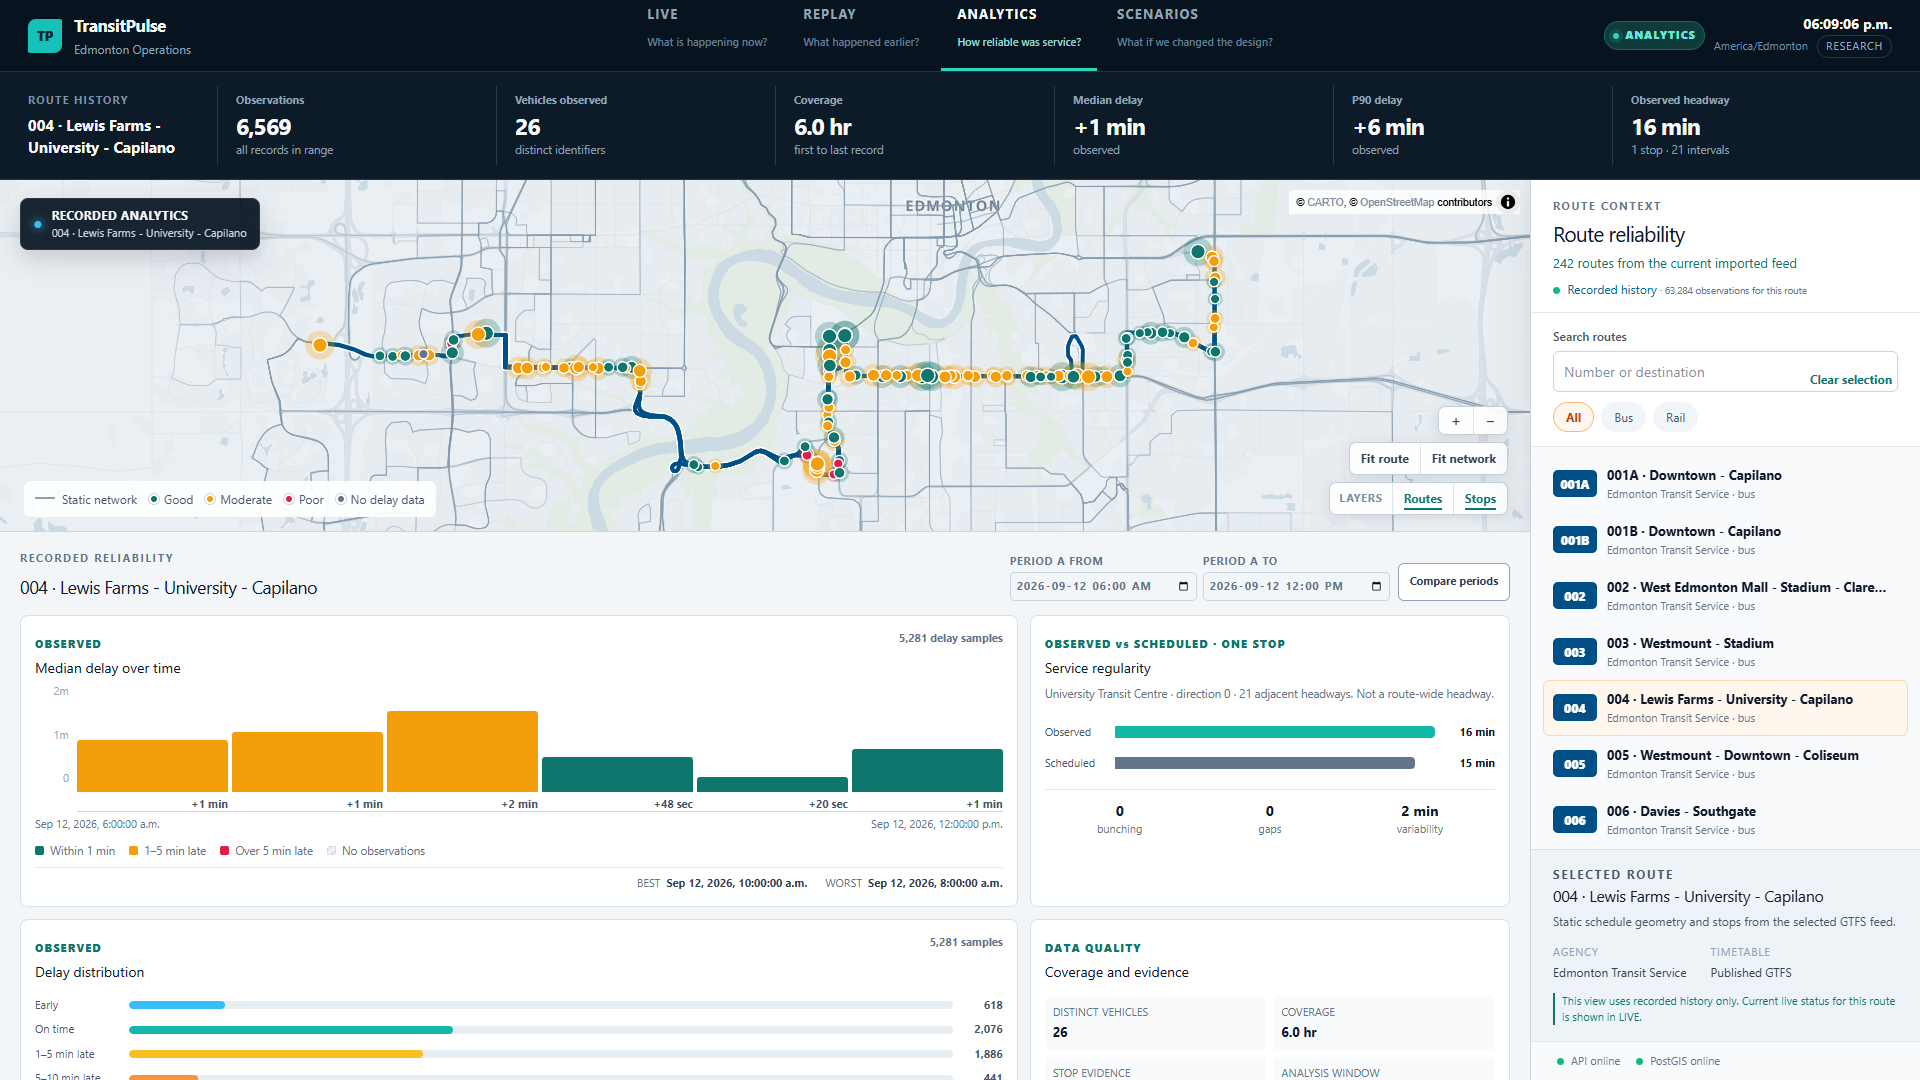
ANALYTICS mode screenshot
Analytics

How reliable was service?

For one route, compares how late vehicles actually ran, and how evenly they were spaced, with the published timetable. Results are broken down by stop and direction, shown on the map, and can be compared between two time periods.

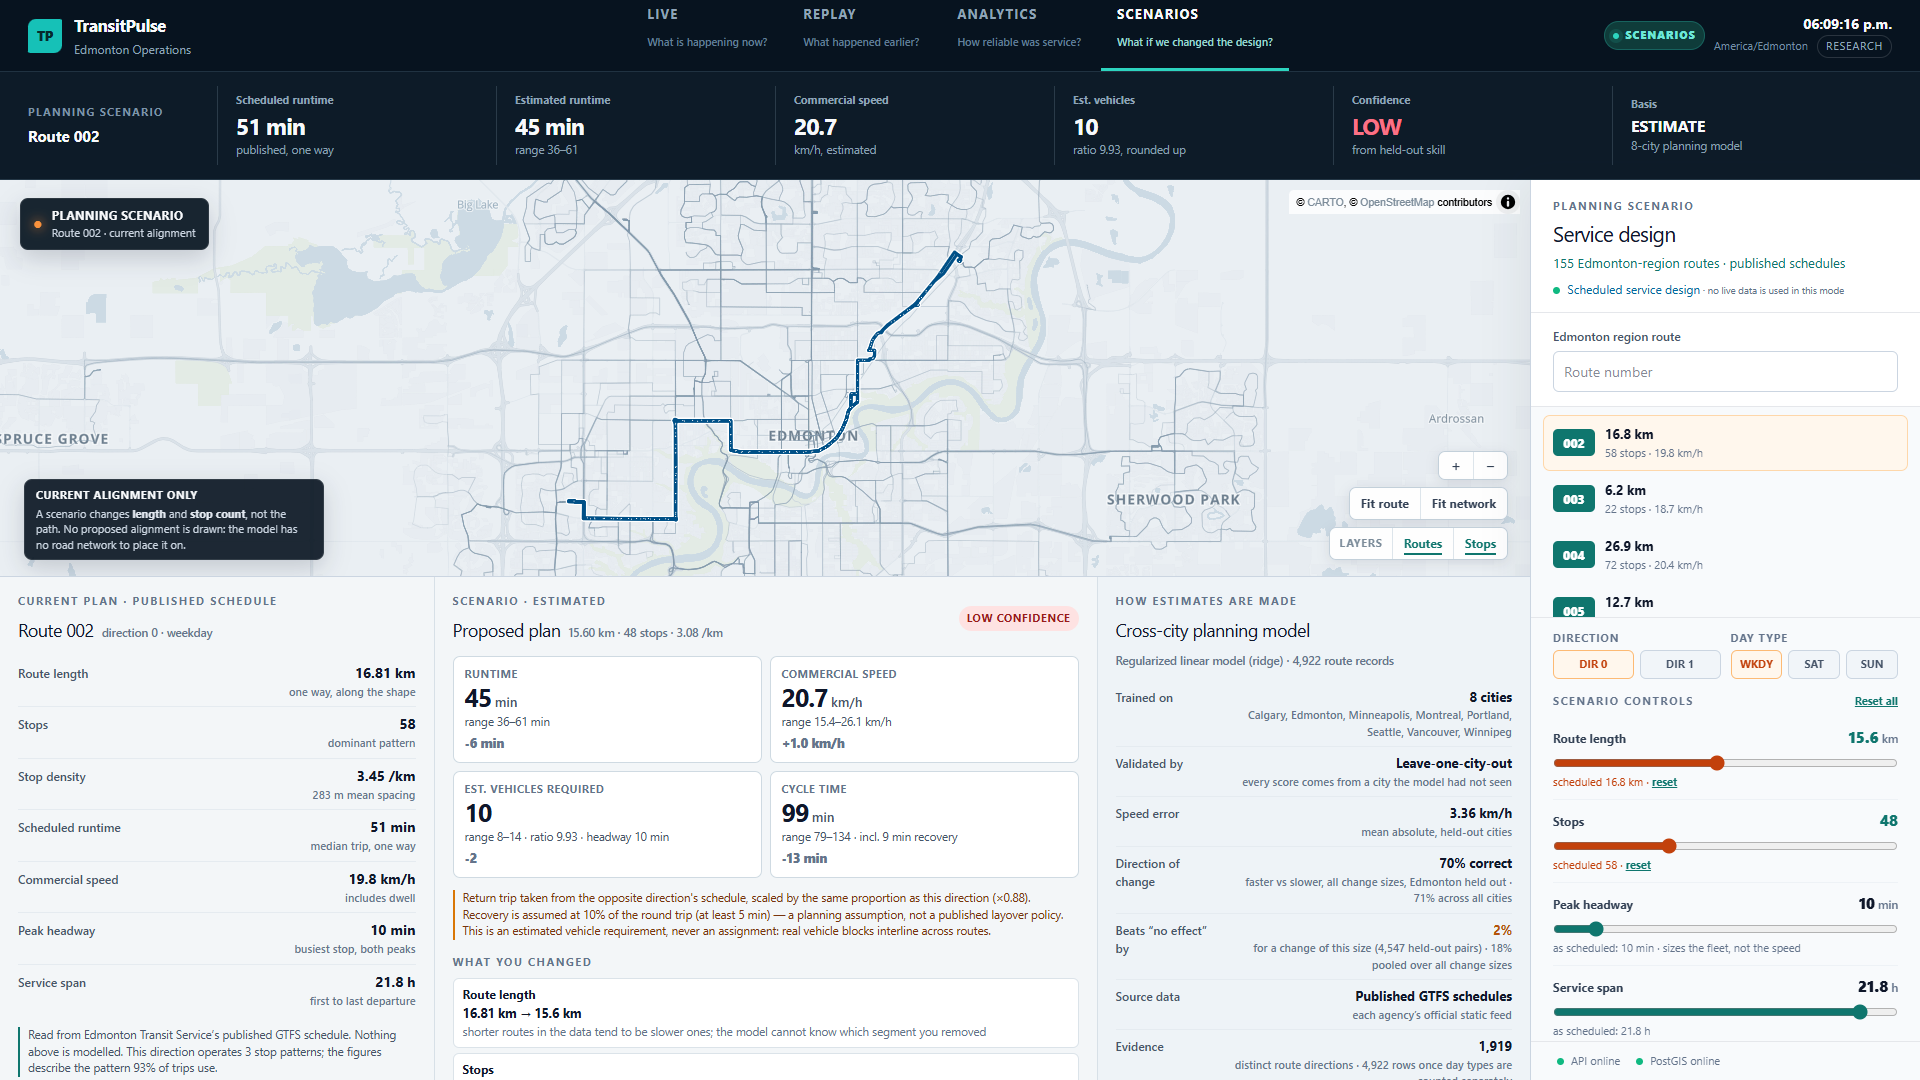
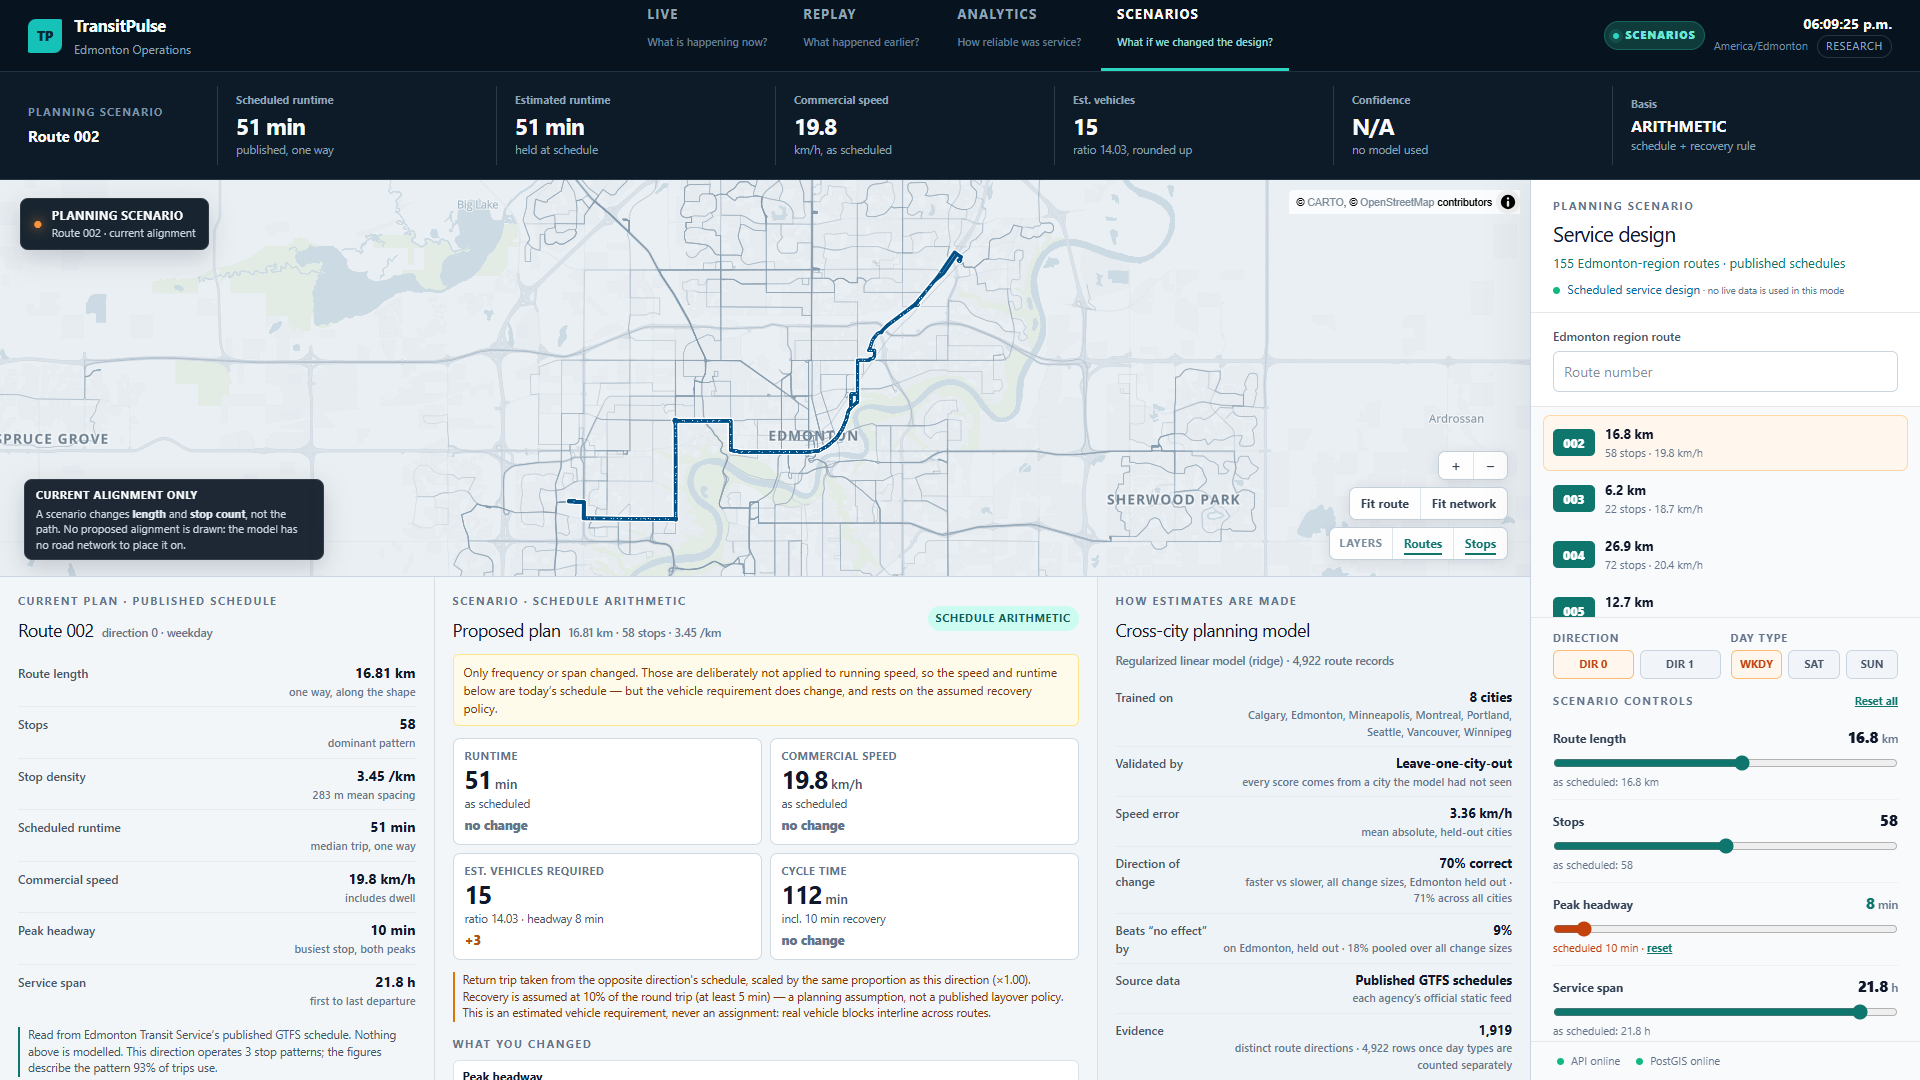
SCENARIOS mode screenshot
Scenarios · experimental

What might change if the route design changed?

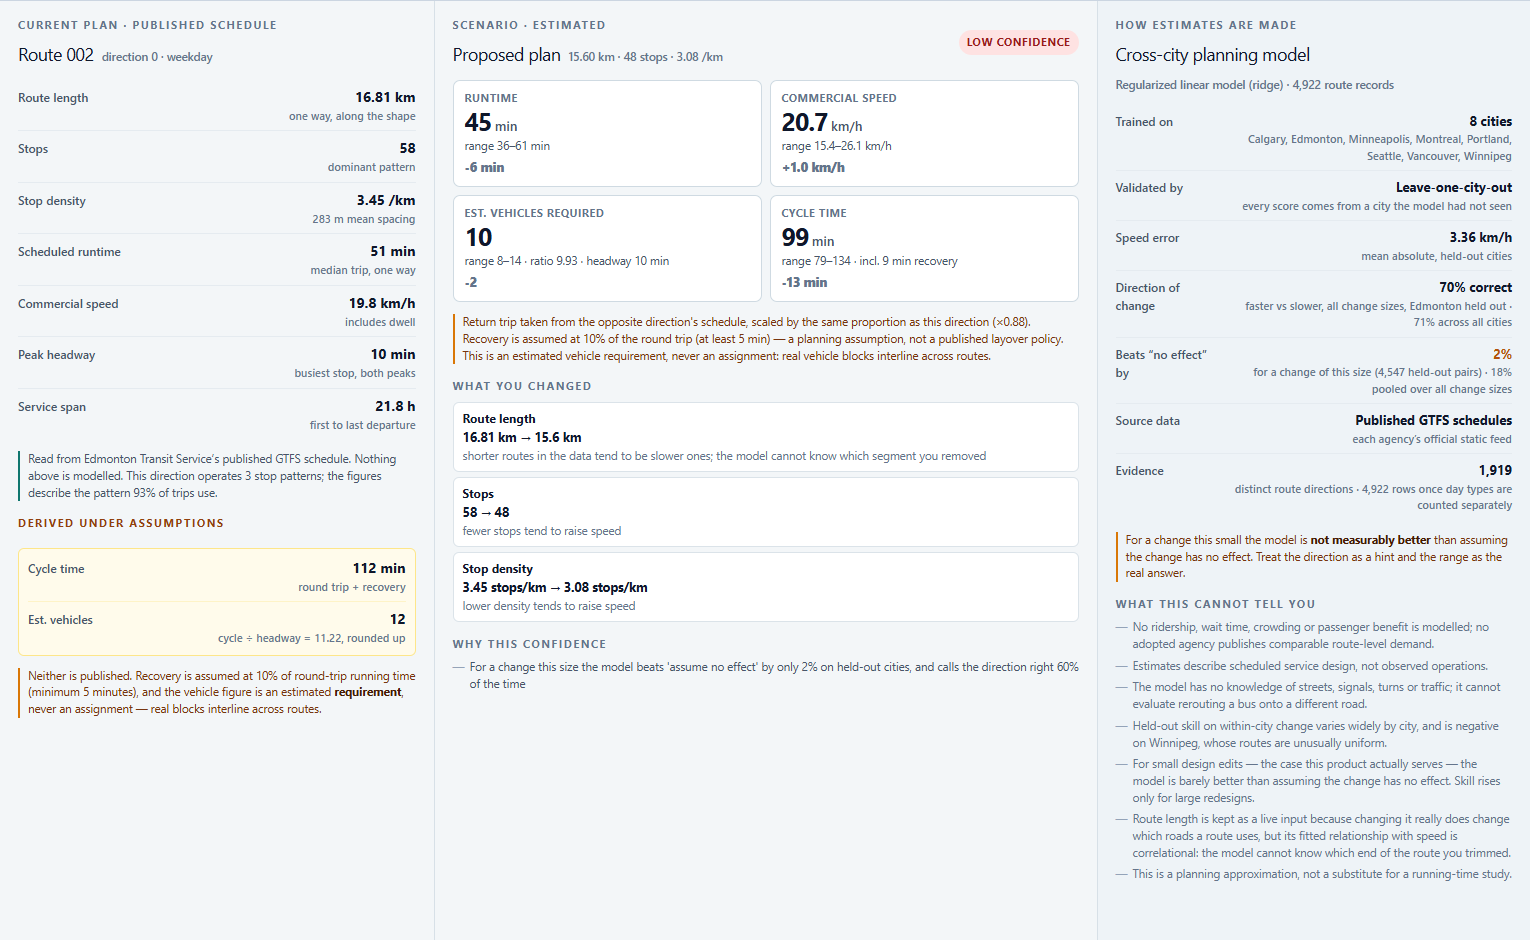
Estimates how a change to a route (its length, number of stops, frequency or hours of service) would affect trip time, speed and the number of vehicles needed. Each estimate has a range and a confidence level based on how accurate the model proved in testing.

How it works

Two streams of data feed one backend: Edmonton's live operations, and timetables from eight cities for planning.

Operations path

  1. Import Edmonton's published timetable and route network. The file is fully checked before anything is saved, and each timetable version is kept separately, so a new import never overwrites an old one. Static GTFS into PostgreSQL/PostGIS, identified by the file's SHA-256 hash.

  2. Record the live feeds for vehicle positions, trip updates and alerts every 30 seconds. The current picture is refreshed, and new observations are added to a history that cannot be edited or deleted. GTFS-Realtime, with the history protected by database triggers.

  3. Serve live operations, replays and route analytics to the web app. Requests have firm limits (a replay covers at most 24 hours and 5,000 records) instead of loading unlimited history.

Planning path

  1. Combine timetables from eight transit agencies into one consistent format, keeping values read from the data separate from values that were calculated or assumed.

  2. Test seven conventional models and a neural network by leaving one whole city out of training at a time, so every score comes from a city the model never saw.

  3. Estimate a scenario by starting from the route's current scheduled speed and adding only the model's predicted change. The range and confidence come from the model's error on unseen cities.

Architecture

A deliberately simple setup: one web app, one backend service and one database, in a single codebase. The Next.js web app passes its data requests through to the FastAPI backend, so the browser only ever talks to one address.

A history that cannot be rewritten

Recorded vehicle observations can be added but never changed or deleted, so Replay and Analytics always show what the feed actually reported. Repeated copies of the same update are recognised and stored once. Enforced by PostgreSQL triggers; each record's key is a hash of the source data and the timetable version.

Locations stored as map data

Stops, vehicle positions and route shapes are stored as geographic data, so the backend can work with them as places and send them straight to the interactive map. PostGIS geometry with spatial indexes, returned to the map as GeoJSON.

Tests that cannot touch real data

Some tests empty database tables while they run. To keep that away from real data, the tests refuse to run unless the database is named as a test database. The full suite of 202 backend tests runs against a separate transitpulse_test database.

Problems solved

  • Making service-frequency numbers accurate. Early calculations made Route 004, scheduled every 15 minutes, look like it ran every 2.5 minutes. Buses going both ways through a shared stop were counted together, and small timing wobbles in the feed were counted as extra arrivals. After fixing both, it measured 902 seconds between buses against a 900-second schedule.
  • Not reporting numbers the data cannot support. When a route has too little recorded data, Analytics withholds its reliability figures. When two time periods have very different amounts of recorded data, the comparison declines to say which was better.
  • Avoiding false service gaps. The live feed includes arrival predictions far into the future, which could make the live view show gaps in service that were not real. Predictions more than 90 minutes ahead are now left out of that calculation.
  • Making data builds repeatable. Building the dataset twice from identical code changed 280 of 842 Edmonton rows. The cause was a tie-break that depended on Python's randomised string hashing. Ties now break on value, and a test checks that repeated builds match exactly.
  • Stopping the model from seeing the answer. The model predicts how fast a route's schedule runs, so any input calculated from that schedule's running time would give the answer away. Those fields are banned from the model's inputs, and a test enforces it. This guards against feature leakage.
  • Fixing a map that failed without an error. After the app was bundled, the map library looked for a background helper file in the wrong place and received a "page not found" response. Detailed map data then silently never loaded, while parts of the map still drew, which hid the problem. A build step now copies the file to a fixed location. MapLibre's tile worker under the Turbopack bundler.

Tech stack

Frontend
Next.js 16, React 19, TypeScript, MapLibre GL 6
Backend
FastAPI, Pydantic, SQLAlchemy 2, GeoAlchemy2
Data
PostgreSQL, PostGIS, Alembic; GTFS and GTFS-Realtime (protobuf)
Modelling
NumPy, scikit-learn; PyTorch for one rejected experiment

Modelling result

The estimator predicts a bus route's scheduled average speed, including time at stops. Each model was trained on seven cities and scored on the eighth, repeated for all eight, so every score comes from a city the model never saw. Scores are the average error in km/h across 4,922 bus route records; lower is better. Leave-one-city-out validation, mean absolute error.

ModelAverage error on unseen cities (km/h)
Ridge regression (used)3.36
Linear regression3.36
Random forest3.46
Histogram gradient boosting3.47
Decision tree3.82
Residual MLP (rejected)3.99
Physical stop-spacing model4.00
Global median4.75
  • A simple linear model beat more complex tree-based models and a small neural network. The neural network fit its training cities well but did poorly on new ones.
  • Scenarios start from the route's real scheduled speed and apply only the model's predicted change, so an unchanged plan returns the published schedule exactly.
  • Frequent routes tend to be slower because busy corridors get more service, not because frequency slows buses down. So frequency is kept out of the speed estimate and only changes how many vehicles are needed.
  • Across all test routes, the estimator beats the simple guess "this change has no effect" by 18%, but by only 0.5–2.3% for small edits. The app shows the figure for the size of change being made.

Screenshots

Limitations and research status

The planning estimates are experimental. They approximate scheduled service, not observed running times. There is no road network and no ridership data, and for small edits the model is barely better than assuming no effect.

Vehicle counts show how many vehicles a route would need, not an actual vehicle schedule, and the layover time added to each round trip is an assumption (10% of the round trip, at least 5 minutes).

Recorded history has gaps whenever the recorder or the feed was down, and an "arrival" means the feed showed a vehicle moving on to its next stop, not an official arrival time.

An earlier single-route simulator experiment never passed validation (none of 68 recorded runs covered the whole route) and is kept only as a research page. An experimental service optimizer is deliberately left out of the UI.

It runs locally. There is no hosted deployment, authentication or rate limiting.